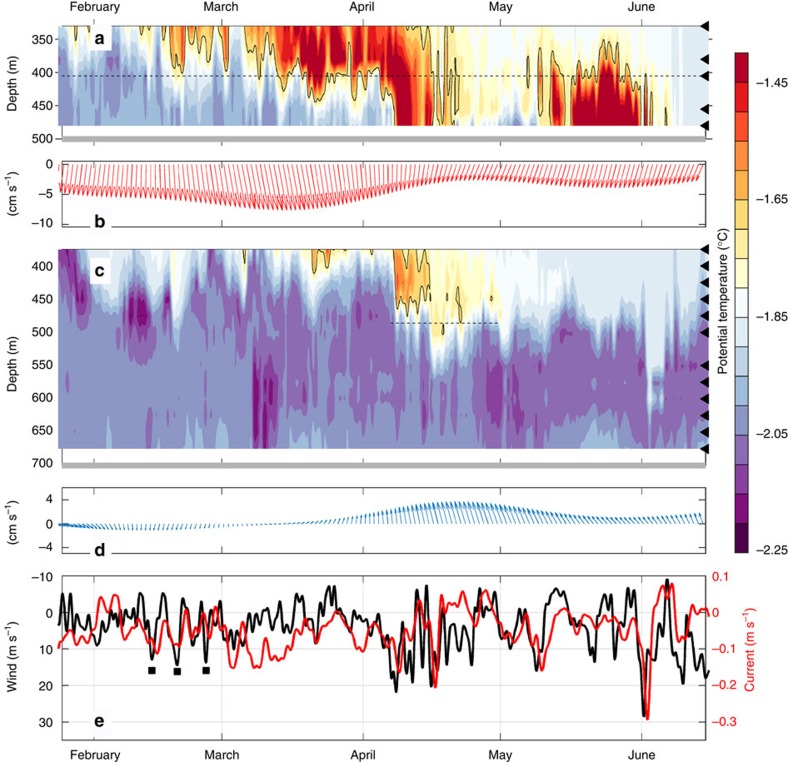
Figure 2. Observations in 2013.
Contours of temperature and current vectors (the latter 30 days low-passed) at (a–c) MNORTH and (b–d) MSOUTH. The sensor depths (temperature) are indicated on the right axis and the −1.7 °C isotherm delineating the Modified Warm Deep Water is highlighted. (e) Along slope current at MNORTH, and wind observed at Halley along the major wind axis (Methods section). Positive values indicate northward current and southwestward (that is, northwesterly) wind, respectively. Note that the wind axis is reversed. The dashed lines in a and c mark the depth of the currents measurements displayed in b,d and e, and the period of current observations discussed in the text, the grey lines in a and c show the sea-floor depth and the black squares in e mark the episodes of near gale winds before March.

