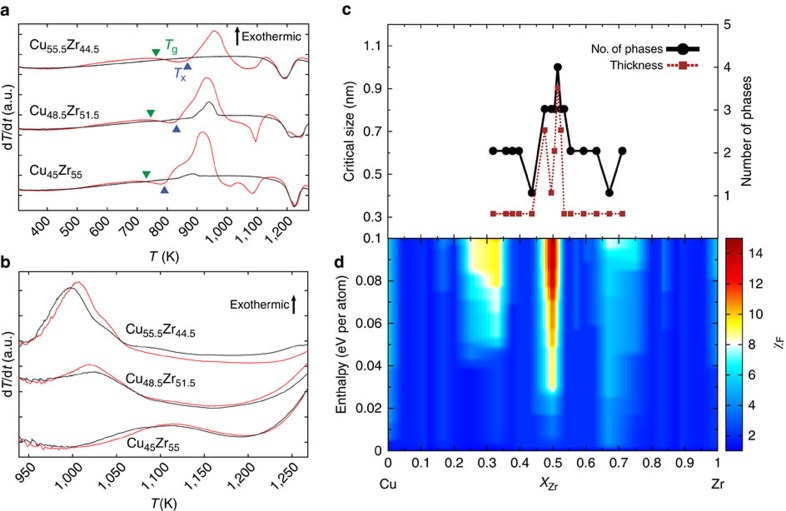
Figure 3. Experimental and theoretical analysis of CuZr.
(a) Nanocalorimetry measurements during heating and (b) cooling at different compositions. The first heating and cooling cycle measurements for the each composition are shown in red, and subsequent measurements are shown in black. (c) Number of phases (solid black line) as measured using X-ray diffraction, and thickness of the amorphous phase (dashed brown line), determined from the wedge shaped samples, as a function of composition. (d) Contour plot of the entropic factor as a function of formation enthalpy (zero corresponds to the ground state of the composition). The colour scale represents the entropic factor, calculated using equation (1), for each composition and formation enthalpy difference. This means that for a given fixed composition (x axis) all phases that are within a given formation enthalpy difference (y axis) from the ground state of that specific composition are used to compute the entropic factor (colour scale). Note the sharp peaks both in the number of states observed in experiment and in the entropic factor at the Cu50Zr50 composition, indicating that the descriptor correctly identifies this composition as having the highest GFA.

