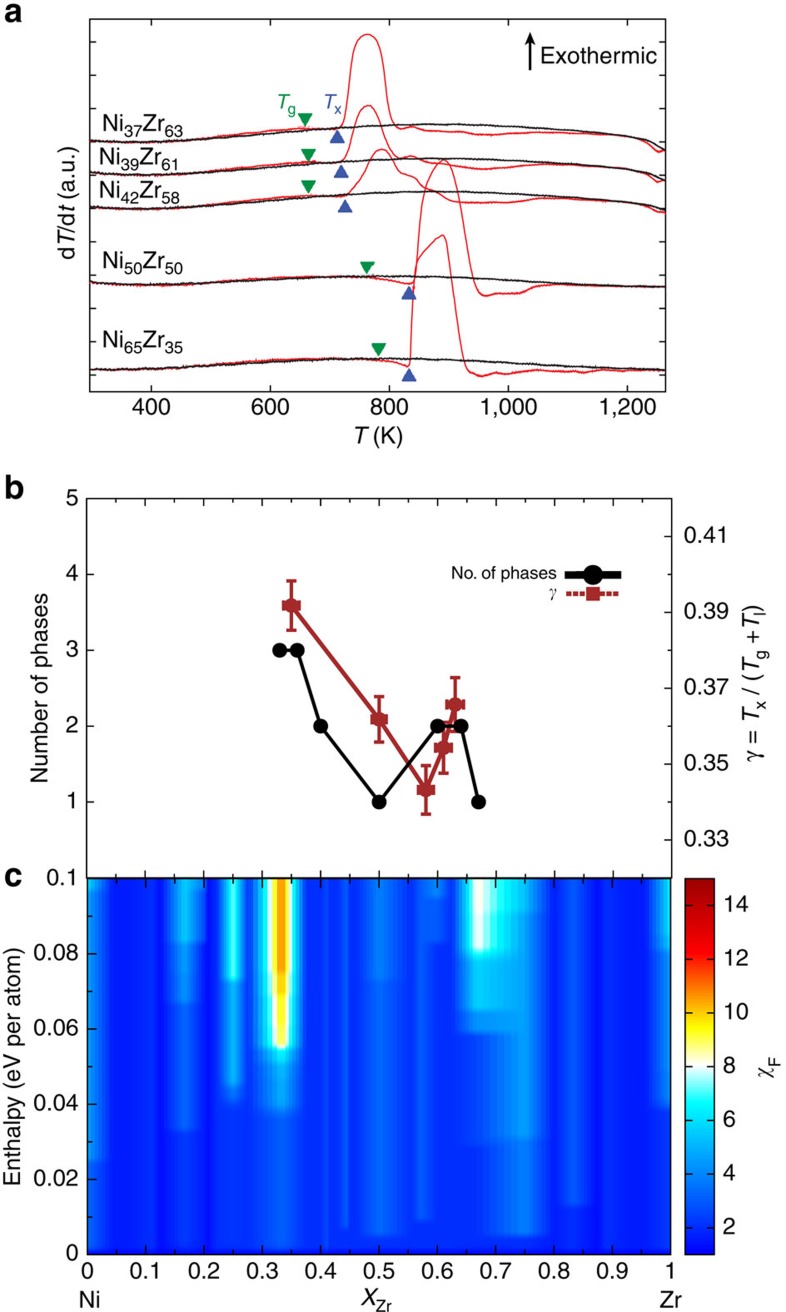
Figure 4. Experimental and theoretical analysis of NiZr.
(a) Nanocalorimetry measurements for NiZr during heating at different compositions. The first heating cycle measurements for each composition are shown in red, and subsequent measurements are shown in black. (b) Number of phases (solid black line) as measured using X-ray diffraction, and γ descriptor calculated for NiZr alloys (dashed brown line). (c) Contour plot of the entropic factor as a function of formation enthalpy (zero corresponds to the ground state of the composition). Note the sharp peaks both in the number of states observed in experiment and in the entropic factor at the Ni35Zr65 and Ni65Zr35 compositions.

