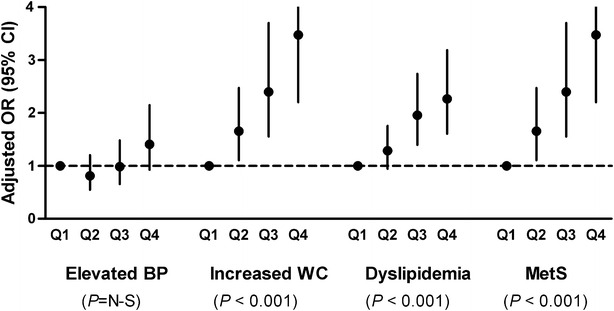
Fig. 1.

Logistic regression to evaluate the OR and 95 % CI for elevated BP, increased WC, atherogenic dyslipidemia, and MetS in GGT quartiles (Q2–Q4) compared to GGT Q1. As the GGT quartiles increased, the OR for increased WC, atherogenic dyslipidemia (high TG or low HDL-C), and MetS significantly increased. The multivariate model was adjusted for age, sex, smoking, alcohol consumption, diabetic duration, HbA1c, and eGFR
