
Figure 2.
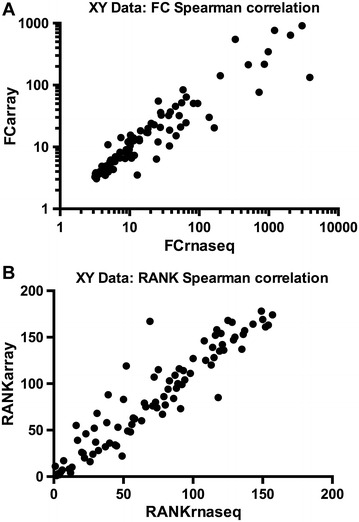
Comparison of expression level and rank of significant ISGs identified by RNA-seq and microarrays. Spearman correlation plots for significant ISGs from: (i) Illumina 100b paired-end RNA-seq and (ii) Affymetrix 32K GeneChip Chicken Genome Array, following induction of CEF for 6 h with 1000 units of rChIFN1, by FC (A) and by Rank (B).