Fig. 2.

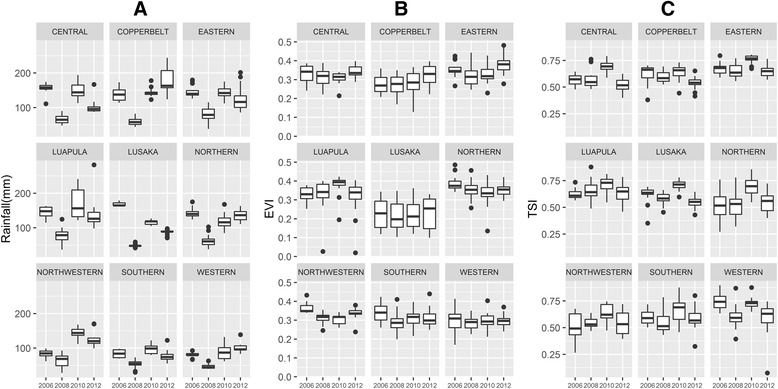
Box plots of SEA-level rainfall (a), enhanced vegetation index (b), and temperature suitability index (c) from best fitting periods preceding each survey, by province and year, Zambia 2006-2012

Box plots of SEA-level rainfall (a), enhanced vegetation index (b), and temperature suitability index (c) from best fitting periods preceding each survey, by province and year, Zambia 2006-2012