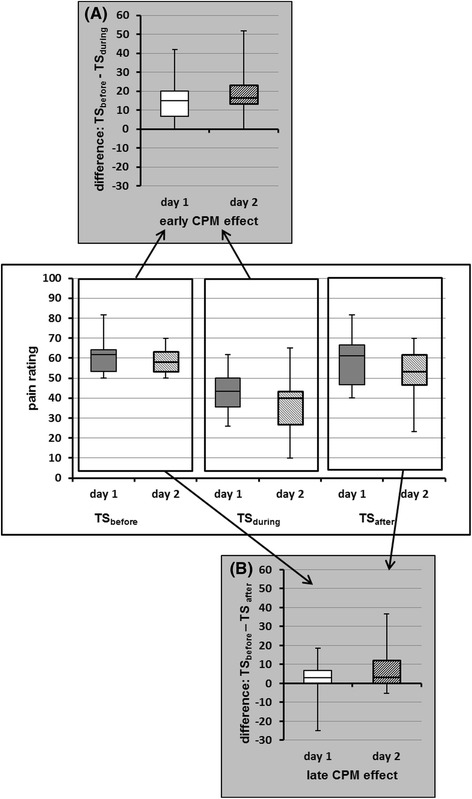
Fig. 2.

Graphic illustration of the CPM effect’s calculation. a Whisker plots of the mean of three pain ratings for TSbefore and TSduring, resulting in the early CPM-effect. b Whisker plots of the mean of three pain ratings for TSbefore and TSafter, resulting in the late CPM-effect. The bottom and the top of the boxes represent the first and third quartiles, the band inside is the median. The ends of the whiskers illustrate the maximum and minimum. TS were applied before, during and after the conditioning stimulus. CPM, conditioned pain modulation; NRS, numeric rating scale; TS, test stimulus
