Fig. 2.

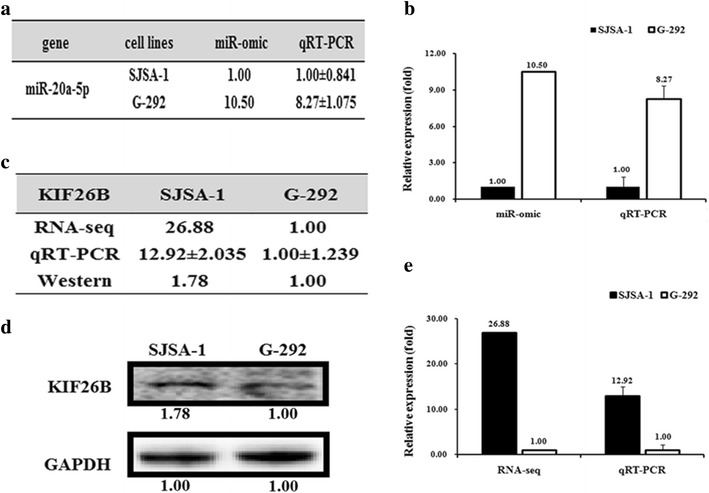
Different expression patterns of miR-20a-5p/KIF26B in SJSA-1 and G-292 cells. The miR-20a-5p expression levels in SJSA-1 cells compared with G-292 cells (summarized in Table a) were analyzed by miR-seq and qRT-PCR analyses in plot b. The expression level of KIF26B is higher in SJSA-1 cells than in G-292 cells, as summarized in Table c. Western blot and qRT-PCR analyses are shown in plots d and e, respectively
