
Fig. 6.
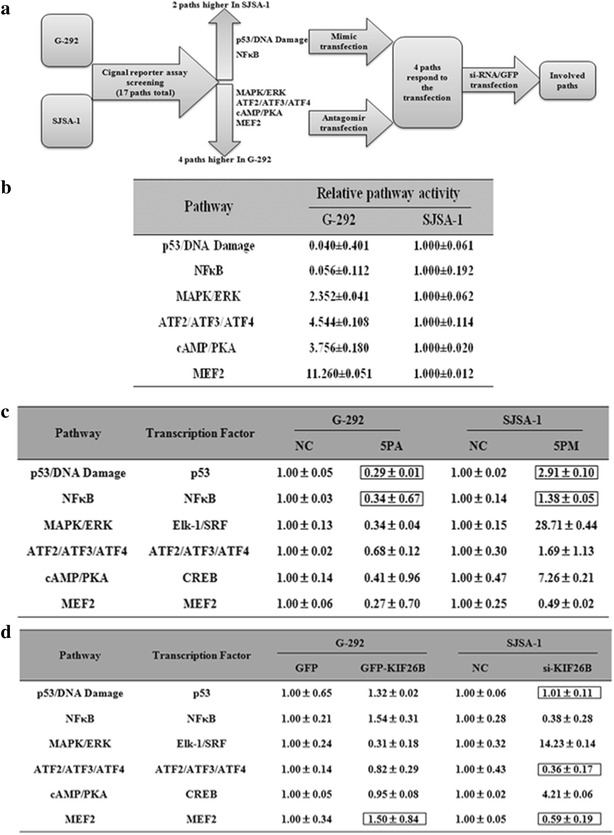
Signaling pathways regulated by miR-20a-5p and KIF26B. a Experimental scheme. b Relative activities (mean ± S.D) of the 6 pathways that differed by more than twofold between SJSA-1 and G-292 cells. c Relative activities of the 6 pathways regulated by miR-20a-5p in OS cells. d Relative activities of the 6 pathways regulated by KIF26B in G-292 and SJSA-1 cells. The boxes indicate the pathways that failed to respond in an expected manner