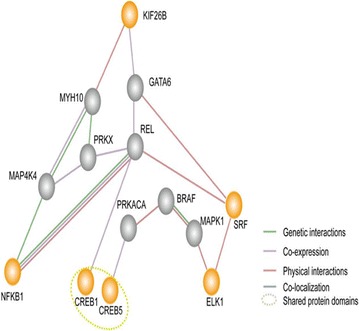
Fig. 8.

A simplified interaction map between the target gene (KIF26B) and the TGFβ, Myc/Max and ATF2/ATF3/ATF4 pathways was generated using GeneMANIA (http://www.genemania.org/). Orange nodes represent the proposed genes. Gray nodes represent genes related to the proposed genes by GeneMANIA. Web-based interface searching provided a large set of functional association data to return related genes based on available genomic and proteomic data. The association data include protein, DNA and genetic interactions and pathways; gene and protein expression data; phenotypic screens and shared protein domains
