Fig. 3.

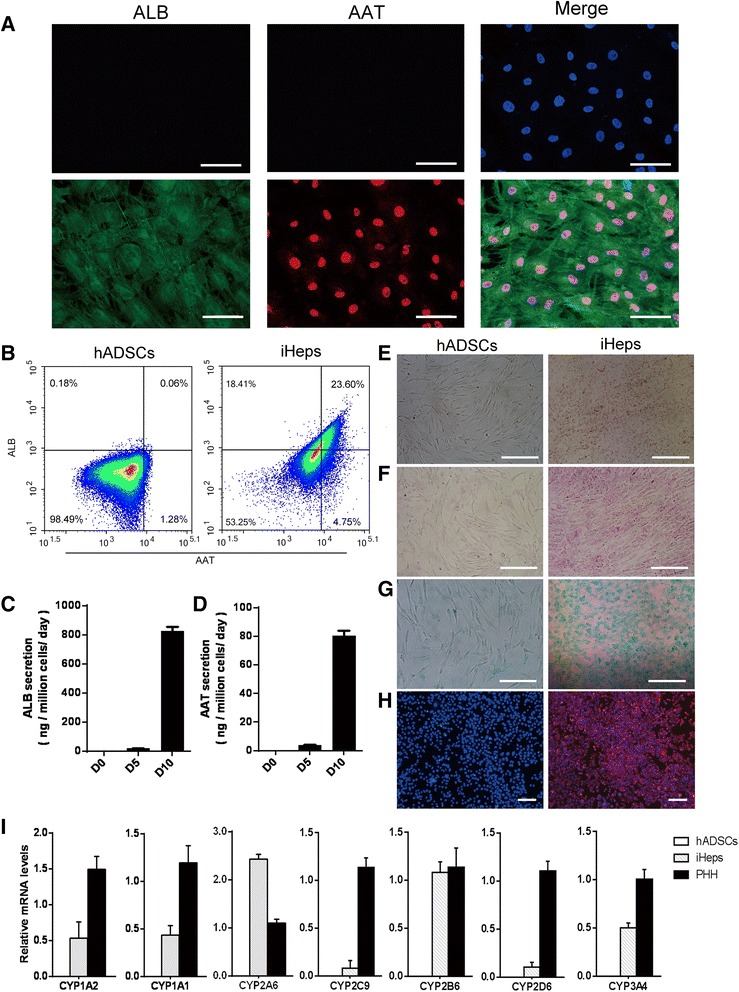
Characterization of induced hepatocytes (iHeps) in vitro. a Immunofluorescence analysis of albumin (ALB) and alpha-1 antitrypsin (AAT) in iHeps. Most iHeps expressed both ALB and AAT at the tenth day. b iHeps were stained for ALB and AAT at 10 days after induction. ALB and AAT double-positive cells, as quantified by flow cytometry, were used to determine the conversion efficiency of iHeps. c, d Secretion of ALB and AAT increased during the hepatogenic induction period as measured by ELISA. e–h Analysis of basic hepatic function in iHeps, including Oil-Red-O staining (e), PAS staining (f), ICG intake (g), and LDL uptake (h). i The mRNA levels of CYP genes were determined by qPCR in human adipose-derived stem cells (hADSCs), iHeps, and primary human hepatocytes (PHH). Data are normalized to β-actin. Scale bars = 100 μm (a, e, f, g), 50 μm (h)
