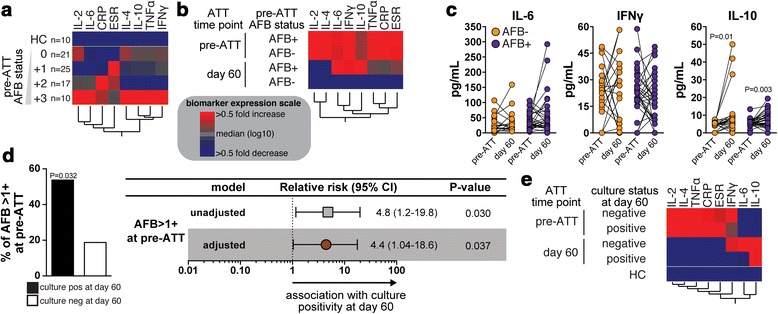
Fig. 2.

Inflammatory profile, mycobacterial loads and culture positivity at day 60 of antimicrobial treatment in PTB patients. a A hierarchical clustering analysis (Ward’s method with bootstrap) was employed to show the immunological profile of TB patients with different AFB status in smear samples at pre-ATT. Data was processed as described in Methods. In the heatmap, the squares represent values below or above the median values (log10) of a given biomarker in the entire study population (n = 73). b The same hierarchical clustering analysis was performed to compare the inflammatory profile of TB patients stratified according to the AFB status in sputum smears at pre-ATT and the study time points. c Serum levels of the indicated cytokines were compared between day 0 and day 60 of ATT in TB patients presenting with positive or negative AFB in sputum smears at study enrollment. Data were analyzed using the Wilcoxon matched pairs test. Significant p-values are shown. d Left panel shows frequency of TB patients with AFB >1+ in sputum smears within the groups of individuals stratified by culture status at day 60 post ATT initiation (positive culture at day 60, n = 13; negative culture, n = 53). Data were compared using the Fisher’s exact test. Right panel shows logistic regression analysis adjusted for age, gender and hemoglobin levels was performed to determine the association between AFB sputum smear > +1 at pre-ATT and culture positivity at 60 day upon ATT initiation. e A hierarchical clustering analysis was employed to illustrate the inflammatory profile of TB patients stratified by treatment time point and culture status at day 60 after ATT initiation
