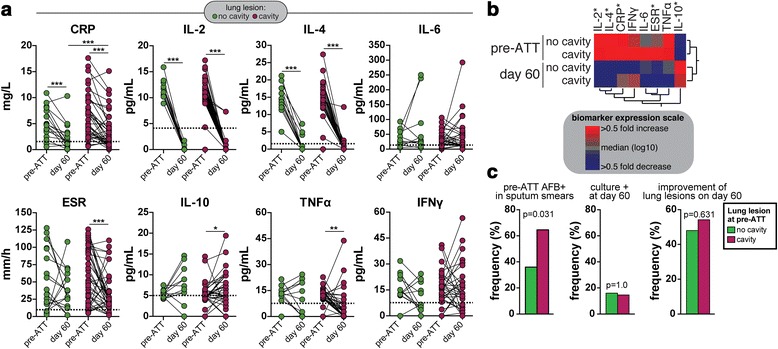
Fig. 3.

Association between cavitary lung disease, systemic inflammation and radiological improvement of TB lung lesions. a Levels of C-reactive protein (CRP), indicated cytokines and erythrocyte sedimentation rate (ESR) were compared between day 0 and 60 of anti-tuberculous treatment (ATT) in TB patients with (n = 42) or without (n = 31) cavitary disease. The Wilcoxon matched pairs test was used to compare changes in the biomarker levels between the timepoints in each clinical subgroup. The Mann–Whitney test was used to compare biomarker values between cavitary vs. non-cavitary TB disease at different timepoint. Dotted lines represent median values detected in age- and gender-matched uninfected and healthy controls (n = 10), to serve as reference. * p < 0.05; ** p < 0.01; *** p < 0.001. b A hierarchical clustering analysis (Ward’s method with bootstrap) was employed to illustrate the inflammatory profile of TB patients stratified by treatment timepoint and cavitary lung disease at pre-ATT. Asterisks highlight the parameters that exhibited statistically significant differences in one or more comparison [shown in (a)]. c frequency of TB patients with or without cavitary TB exhibiting AFB+ smears at pre-ATT (left panel), positive M. tuberculosis sputum culture (center panel) and improvement of lung lesions assessed by chest X-rays at day 60 of treatment.. Data were compared using the Fisher’s exact test
