Fig. 6.

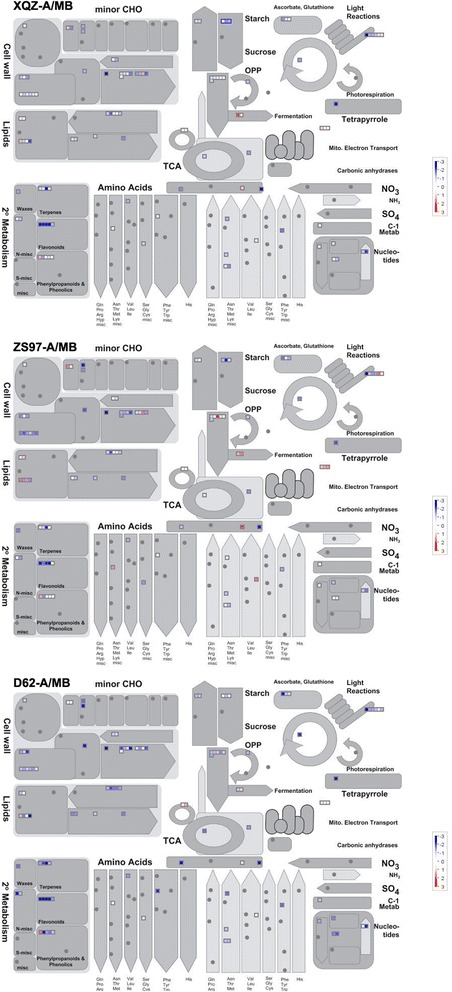
Overview of the metabolism of the three CMS lines by MapMan. The colour key represents normalized log2 values. Red represents up-regulation and blue represents down- regulation between the CMS line and maintainer line

Overview of the metabolism of the three CMS lines by MapMan. The colour key represents normalized log2 values. Red represents up-regulation and blue represents down- regulation between the CMS line and maintainer line