Fig. 6.

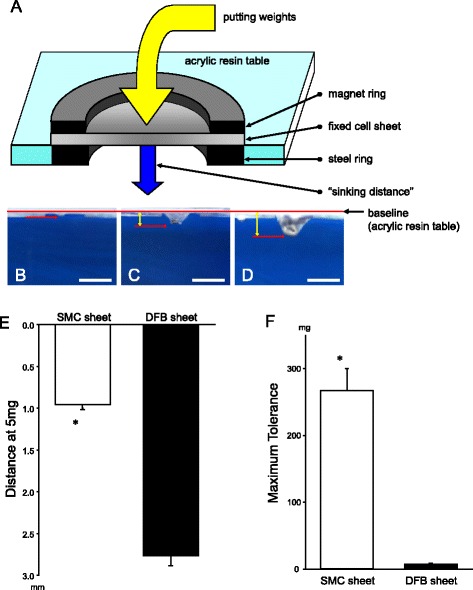
Representative schema of custom-made apparatus to measure cell sheet strength (a). Cell sheets were stretched by weights and photographed. “Sinking Distance” was then measured (blue arrow). Representative pictures of stretched cell sheet by weight loading to measure cell sheet strength (b–d). SMC sheet at 5 mg (b), DFB sheet at 5 mg weight (c) and SMC sheet at 200 mg (d). “Sinking Distance” was measured as a distance within red bars and red arrows (yellow bicephalic arrows). Scale bar (white bar) = 5 mm. Sinking distance at 5 mg (e) and maximum weight tolerance (f) was measured. *p < 0.05 vs. DFB sheet. SMC, smooth muscle cell; DFB, dermal fibroblast. Each groups n = 3
