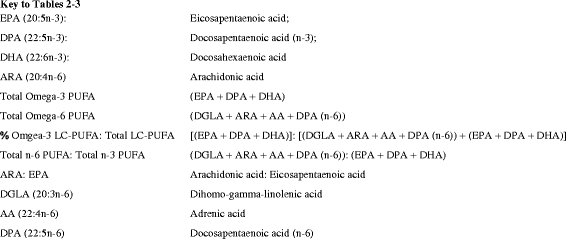
Table 2.
Distribution of median (IQR) LC-PUFA levels (% wt/wt) by gender and age group of 297 Zimbabwean children
| Variables | LC-PUFAs (% wt/wt) | ||||||||
|---|---|---|---|---|---|---|---|---|---|
| EPA | DPA | DHA | ARA | Total Omega-3 LC-PUFA | % Omega LC-PUFA: Total LC-PUFA | ARA: EPA | Total n-6 PUFA: Total n-3 PUFA | ||
| Median (IQR) (n = 297) | 0.18 (0.15–0.23) | 0.79 (0.70-0.89) | 2.14 (1.87-2.42) | 10.62 (9.77–11.38) | 3.13 (2.83–3.49) | 18.42 (17.10–19.92) | 57.47 (44.72–72.24) | 10.82 (9.83–11.79) | |
| Mean (SD) (n = 297) | 0.20 (0.071) | 0.81 (0.17) | 2.15 (0.40) | 10.56 (1.26) | 3.55 (0.53) | 18.11 (2.27) | 61.31 (23.64) | 10.91 (1.62) | |
| Range All (n = 297) | 0.06–0.55 | 0.38–0.198 | 1.13–3.52 | 5.58–14.64 | 1.73–5.95 | 13.34–28.11 | 15.47–163-33 | 5.94–16.03 | |
| Children’s gender median IQR) | Boys (n = 127) | 0.19 (0.15–0.23) | 0.81 (0.72–0.91) | 2.11 (1.91–2.46) | 10.55 (9.80–11.32) | 3.25 (2.62–3.42) | 18.38 (17.32–19.94) | 57.16 (45.24–71.82) | 10.71 (9.78–11.68) |
| Girls (n = 170) | 0.18 (0.15–0.24) | 0.78 (0.70–0.89) | 2.15 (1.84–2.36) | 10.67 (9.73–11.46) | 3.10 (2.82–3.47) | 18.44 (16.94–19.89) | 57.72 (44.09–72.91) | 10.95 (9.88–11.97) | |
| Children’s Age group median (IQR) | (7) (n = 21) | 0.17 (0.13–0.18) | 0.78 (0.74–0.86) | 2.27 (2.03–2.48) | 10.89 (10.68–11.75) | 3.18 (2.92–3.53) | 18.20 (16.69–19.52) | 64.38 (59.71–91.04) | 10.60 (9.93–11.89) |
| (8) (n = 93) | 0.20 (0.16–0.24) | 0.81 (0.70–0.93) | 2.16 (1.93–2.51) | 10.63 (9.61–11.39) | 3.18 (2.87–3.57) | 18.64 (17.35–20.18) | 56.43 (41.39–72.02) | 10.55 (9.68–11.45) | |
| (9) (n = 183) | 0.18 (0.15–0.23) | 0.79 (0.70–0.89) | 2.10 (1.83–2.35) | 10.48 (9.76–11.35) | 3.09 (2.80–3.40) | 18.34 (16.94–19.88) | 55.87 (44.90–70.64) | 10.94 (9.87-12.01) | |
| p-values | P = 0 .049a | P = .014a | |||||||
p-values calculated using Kruskal Wallis Test Asterisks: Significance tests: aStatistically Significance (p < 0.05) (2-tailed)

