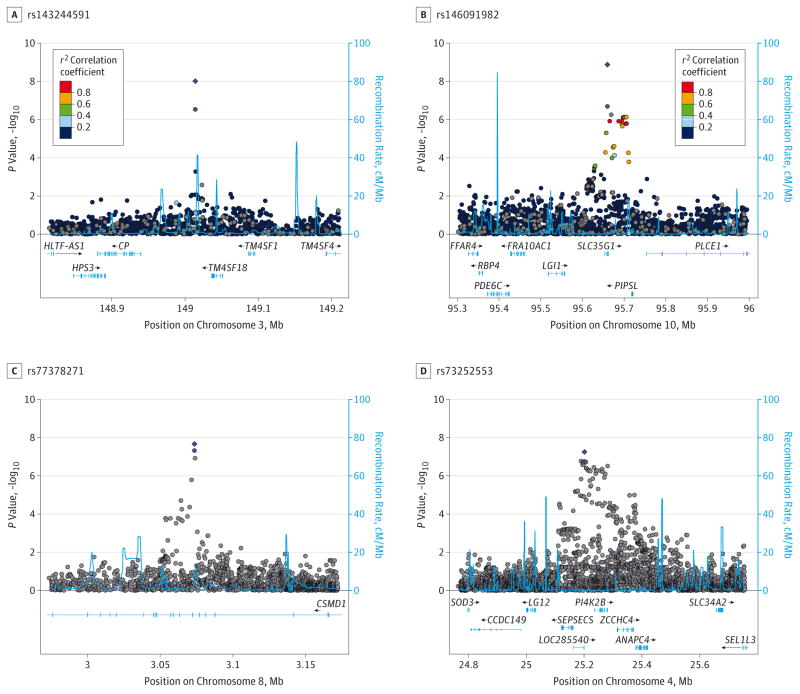
Figure. Regional Manhattan Plots of Association Results for DSM-IV Cannabis Dependence Criterion Count in 4 Genomic Regions.
Association results from single-nucleotide polymorphisms (SNPs) in 4 regions. A, The 148.8- to 149.2-MB region encompassing RP11-206M11.7 on chromosome 3 in the Yale-Penn and Study of Addiction: Genetics and Environment (SAGE) African American participants. B, The 95.3- to 96-MB region encompassing SLC35G1 on chromosome 10 in the Yale-Penn and SAGE African American participants. C, The 2.8- to 4.8-MB region on chromosome 8 encompassing CSMD1 in the Yale-Penn, SAGE, and International Consortium on the Genetics of Heroin Dependence (ICGHD) African American and European American participants. D, The 25.07- to 25.43-MB region encompassing PI4K2B on chromosome 4 in the Yale-Penn, SAGE, and ICGHD African American and European American participants. In A and B, the SNPs are color coded according to the correlation coefficient (r2) in the 1000 Genomes African samples with the most significant SNP. In C and D, results from the African American and European American participants were combined, and no linkage disequilibrium information was displayed. The light purple circle represents the −log10 P value for the most significant regional SNP in the meta-analysis of the discovery samples; the purple diamond, the result for that SNP after meta-analysis with the replication sample(s). The light blue line and right y-axis show the observed recombination rate.

