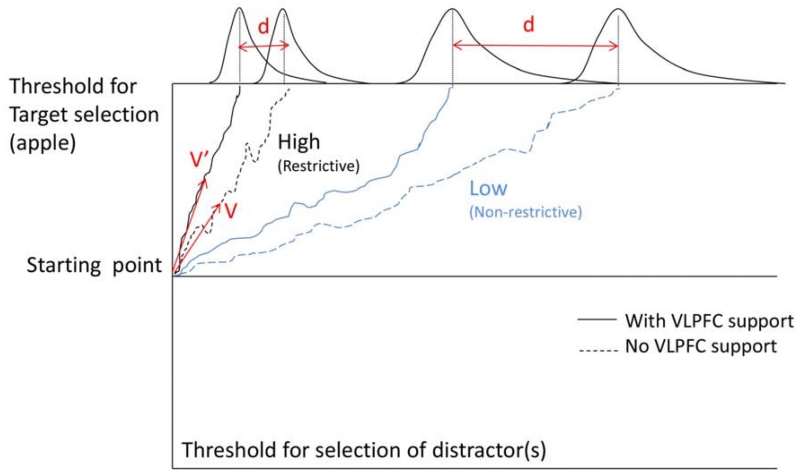
Figure 5.
A schema of the Drift Diffusion Model. Blue lines show the process of locating a target with low association to input (e.g., the Non-restrictive condition). Black lines show the process of locating a target with high association to input (e.g., the Restrictive condition). The dotted lines show the accumulation of evidence in the absence of VLPFC contribution. The solid line show this process facilitated by VLPFC. Parameters v and v’ are drift rates (see text), and the difference between them marks the difference in the speed of target activation with and without VLPFC contribution. The top part of the figure shows hypothetical response latency distributions. Parameter d is related to the distance between the means of the two distributions and quantifies the effect of VLPFC in facilitating the process of locating the target; the smaller the possible contribution of VLPFC.

