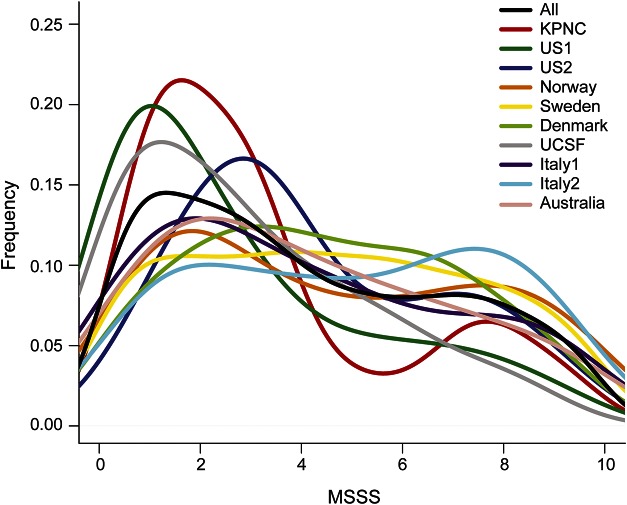
Figure 1. Density plot of MSSS by cohort.
The density plot represents the frequency distribution of MSSS in each of the 10 cohorts and the total 7,125 individuals with MS. KPNC = Kaiser Permanente Medical Care Plan in the Northern California Region; MS = multiple sclerosis; MSSS = Multiple Sclerosis Severity Score. UCSF = University of California at San Francisco.

