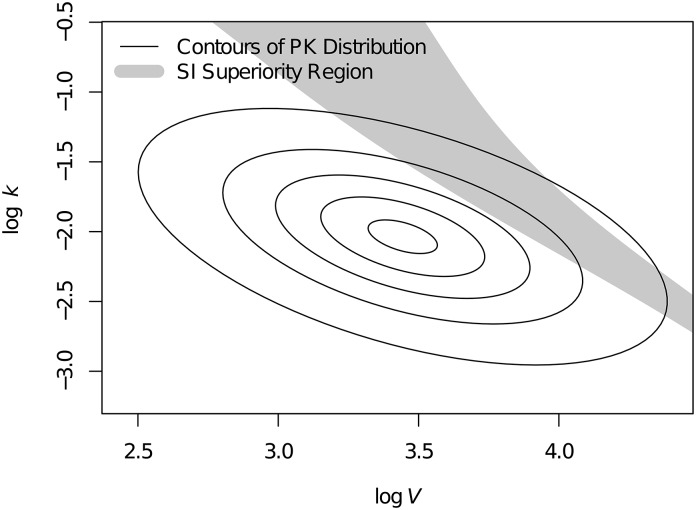
Figure 4.
Region of pharmacokinetic (PK) parameter space in which short infusion (SI) is associated with greater than four times minimum inhibitory concentration relative to extended infusion for the 3 g/8 h regimen. Concentric ellipses represent the distribution of PK parameter values in the studied population, where values near the center occur more frequently than values farther from center. Thus, in contrast with the prevailing trend, some patients in this population may benefit more from SI versus extended infusion. The volume of distribution (V) and the elimination rate (k) are displayed on a natural logarithm scale.

