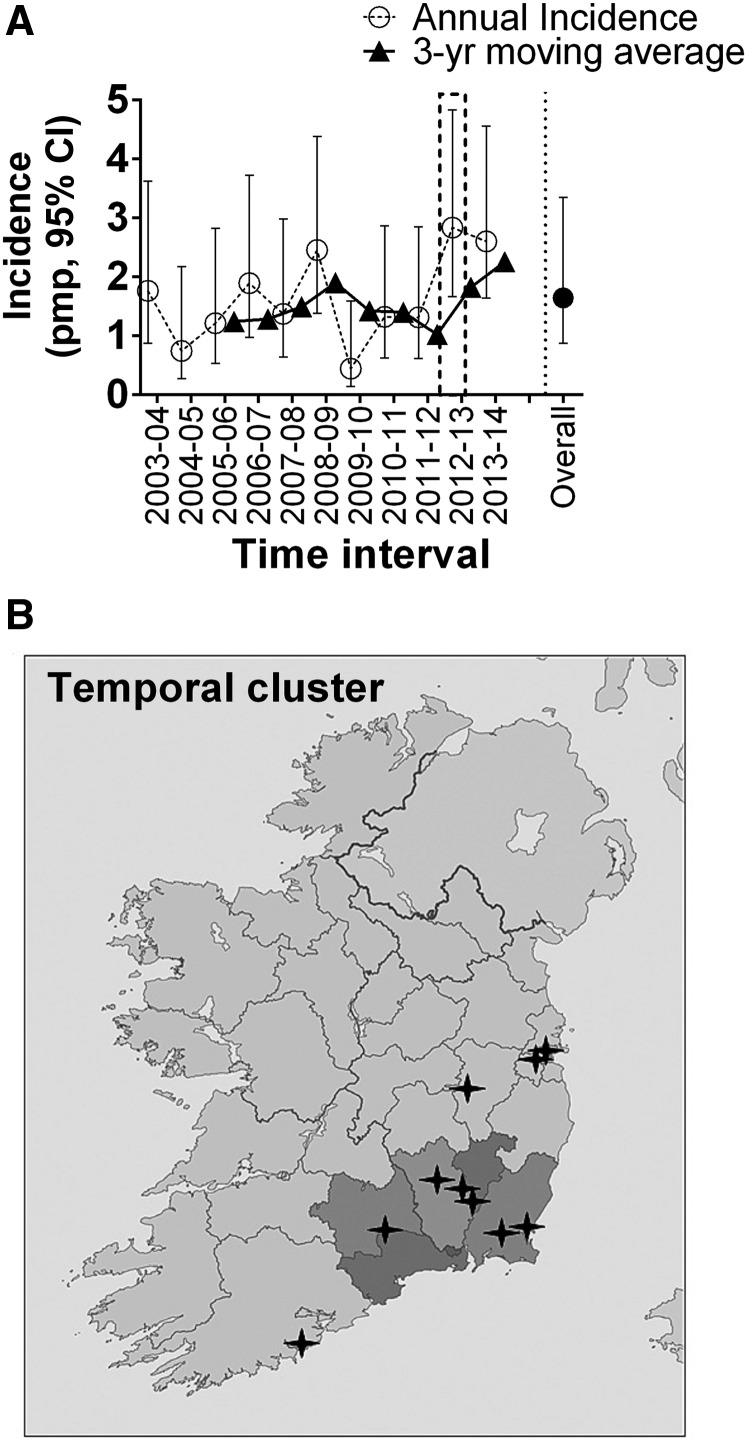
Figure 2.
Incidence and temporal clustering. (A) Annual incidence rates (with 95% confidence intervals [95% CIs]) for each year of the study period, expressed as per million population (pmp). (B) The location of cases diagnosed in the temporal cluster (represented by black stars). Six cases were resident in the southeast of the country (area shaded in dark gray).

