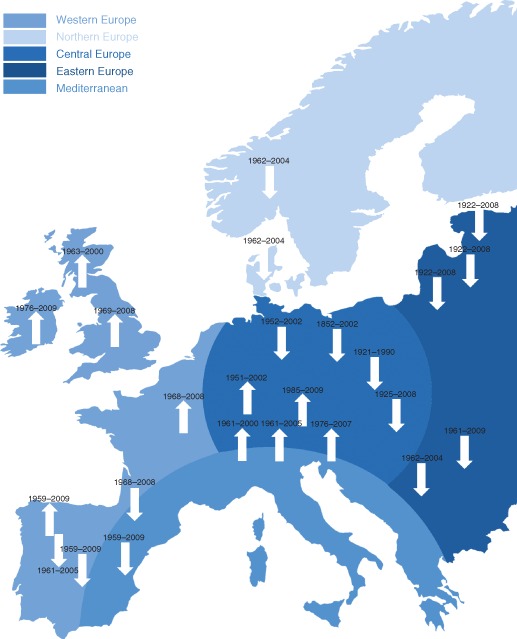
Figure 3.

Summary of trends in flood peak runoff in the last decades in Europe obtained from different studies and study periods. Upward pointing arrows indicate increasing trends and downward pointing arrows represent decreasing trends. Both are related to the majority of trends in a region. No arrows are shown in areas with inconclusive data and/or results (Reprinted with permission from Ref 2. Copyright 2014). Published by Copernicus Publications on behalf of the European Geosciences Union.
