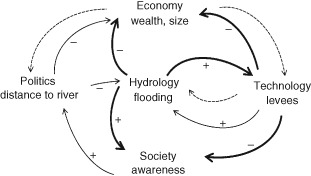
Figure 14.

Loop diagram showing how hydrological, economical, political, technological, and social processes are all interlinked and gradually (continuous thin arrows) coevolve, while being abruptly (continuous thick arrows) altered by the sudden occurrence of flooding events. Dashed arrows indicate more indirect control mechanisms (Reprinted with permission from Ref 18. Copyright 2013). Published by Copernicus Publications on behalf of the European Geosciences Union.
