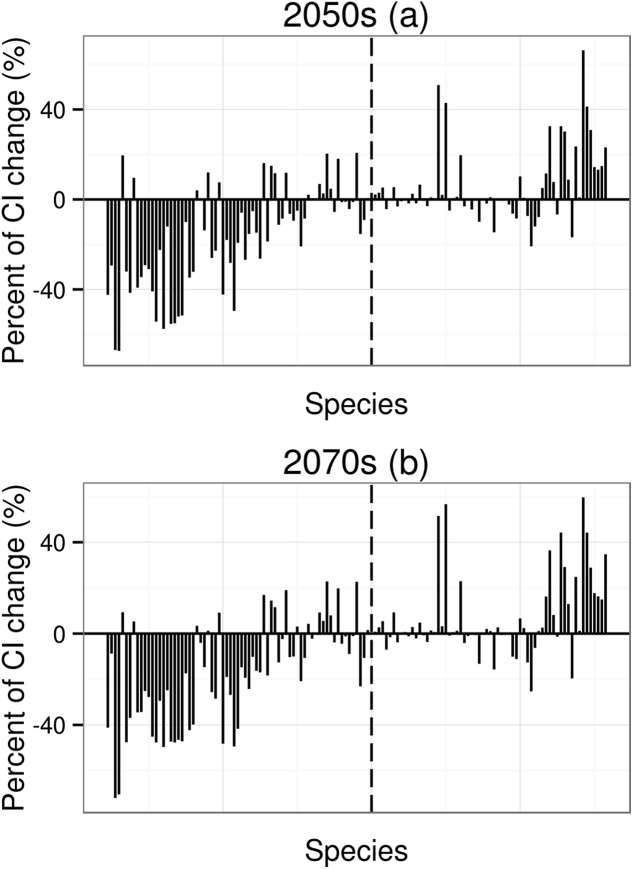
Figure 3. Percent of coherence index (CI) change.
CI is the probability that two animals placed in different areas (patches) will find each other. The order of 134 species in X axis from left to right depends on the order of mean value of area change (from low to high, to make thing to be comparable, the 2070s using the order of the 2050s). The dotted line means that the potential distribution area has no any change under future climatic change.

