
FIGURE 12.
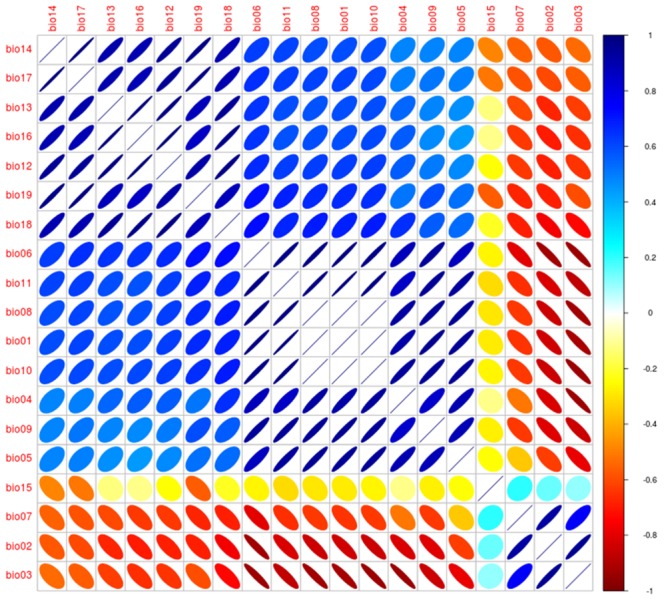
Correlalogram from the Worldclim variables. Correlation between variables was explored for the 19 Worldclim bioclimatic variables obtained from Hijmans et al. (2005) as in Escobar (2016). Size of ellipsoids denotes high (broad) and low (narrow) variability, direction of ellipsoids represents positive (right) or negative (left) association, colors denote correlation coefficient values to identify high negative (red), low (yellow), and high positive (blue). Analysis was developed using NicheToolBox (Osorio-Olvera, 2016).