
FIGURE 3.
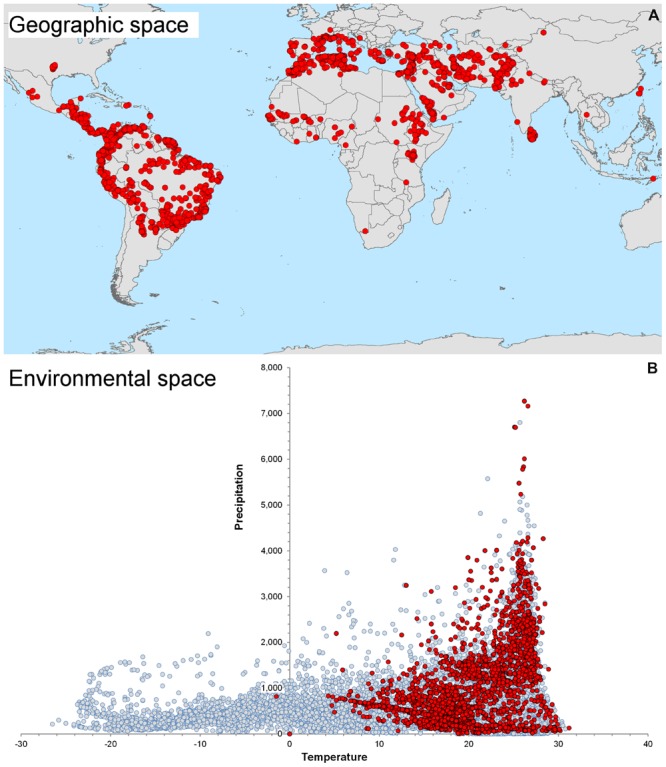
Global distribution of cutaneous leishmaniasis. (A) Visualization of 6,426 cutaneous leishmaniasis occurrences (red points) in the geographic space. (B) Distribution of leishmaniasis in the environmental space. Some occurrences have identical environmental values and therefore resulted in 1,954 single occurrences in the environmental space (red points). Notice the diversity of environments available across the globe (gray points) and the consistent, narrow, predictable environmental space occupied by the disease. The environmental space (gray points) was generated using 10,000 random points globally to capture values of temperature (x axis) and precipitation (y axis). Data obtained from Hijmans et al. (2005) and Pigott et al. (2014a).