
FIGURE 7.
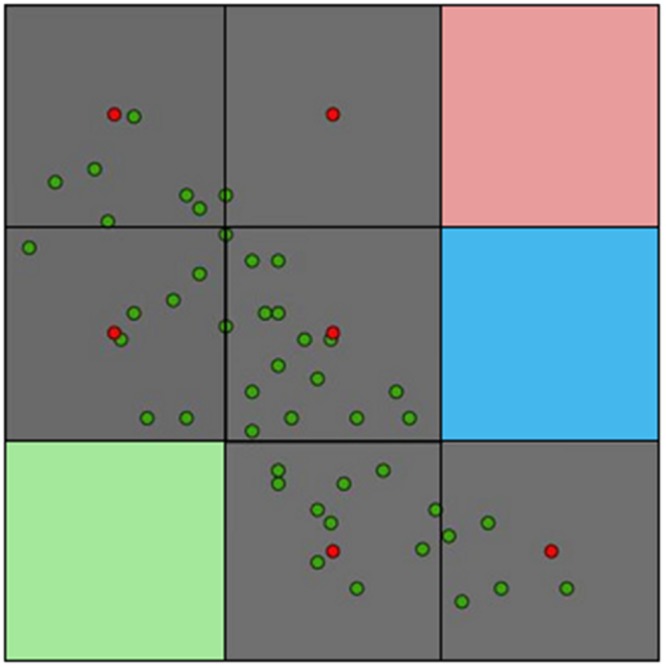
Example of occurrences represented in geographic and environmental terms. Original reports of disease (green points) can be an overrepresentation of environmental conditions associated with sampling bias. The study area (grid) may require a resampling strategy to obtain only one report per environmental cell to mitigate model overfitting in oversampled areas (red points). In this study area four environmental values are present: gray, pink, blue, and green. A more strict modeling approach (e.g., Qiao et al., 2016) would require only one point per environmental value. Thus, in this example, only one value representing the occupied environment (i.e., gray) should be considered for modeling purposes. Source (Escobar and Peterson, 2013).