Figure 2.

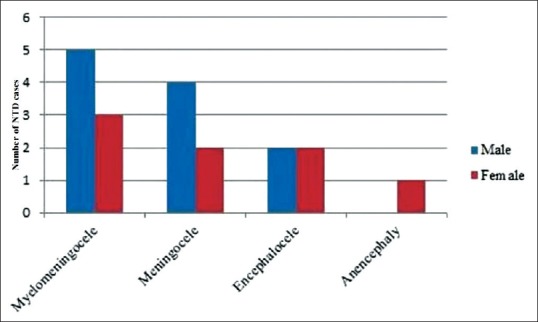
Gender distribution of the neural tube defects illustrated by bar diagram. This figure shows that the numbers of neural tube defect cases including myelomeningocele and meningocele were higher in males than females

Gender distribution of the neural tube defects illustrated by bar diagram. This figure shows that the numbers of neural tube defect cases including myelomeningocele and meningocele were higher in males than females