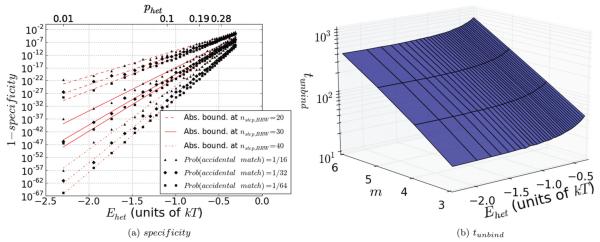
FIG. 4.
(Color online) Results for the statistical well, calculated for phom = 0.7, or equivalently Ehom ≈ 0.42kT, and for ninitial,BRW = 3. In (a), we see a plot of the false positive binding rate, or 1 – specificity, for a given binding event to a heterologous sequence in the sequence dependent state. The specificity has been averaged over all values of m weighted by their relative occurrence frequencies and is given as a function of Ehet, with the corresponding values of phet shown above. The plots were calculated by imposing an absorbing boundary at nstep,BRW = 0 and nstep,BRW = 20,30,40. Although the results change for different positions of the absorbing boundary, the specificity is extremely high in all cases. In order to account for additional possible matches after the first m, results were averaged over many (2000 trials) sequences with random accidental matches after the first m matches. Within each triplet of equally rendered curves, the three lines from bottom to top were calculated with a probability of an accidental match of 1/64, 1/32, and 1/16, respectively. The raw data are shown as squares, diamonds, and triangles, respectively, while the lines represent linear fits. As expected, more matches increase the false positive binding rate. Although the real value is 1/64, the other values where included due to the random nature of the trials in order to provide confident upper bounds, or “worst-case scenarios” for the false positive binding rate. For a mismatch energy penalty of Ehet ~ 1.5kT per triplet, as would be expected purely due to Watson-Crick mismatching, a specificity in excess of 1–10~30 is achieved with a boundary at position 30. In (b), we see the mean unbinding time as a function of m and Ehet. The key feature here is that the exponential dependence of tunbind on m, which was emphasized in Eq. (21) and appears as a linear dependence in this logarithmic plot, is unchanged for different Ehet. The only difference is a constant multiplicative offset to the scaling. This offset is a consequence of the effective width of the statistical well, which is due to the finite value of phet. These two figures indicate that the statistical well behaves essentially like an effective infinite barrier, because it preserves both the specificity and the scaling laws of the infinite barrier.

