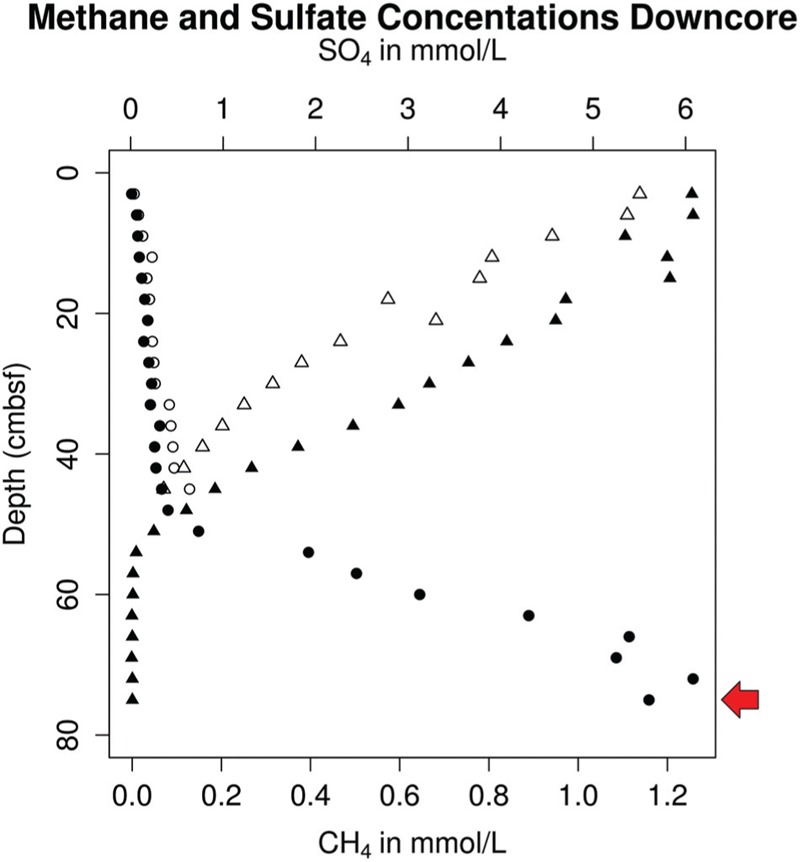
FIGURE 2.

Aqueous porewater concentrations of sulfate (triangles) and methane (circles) in replicate sediment cores (open/filled-in) taken from White Oak river estuary Station H in October 2012, with a red arrow indicating the depth at which samples for single-cell sorting were taken.
