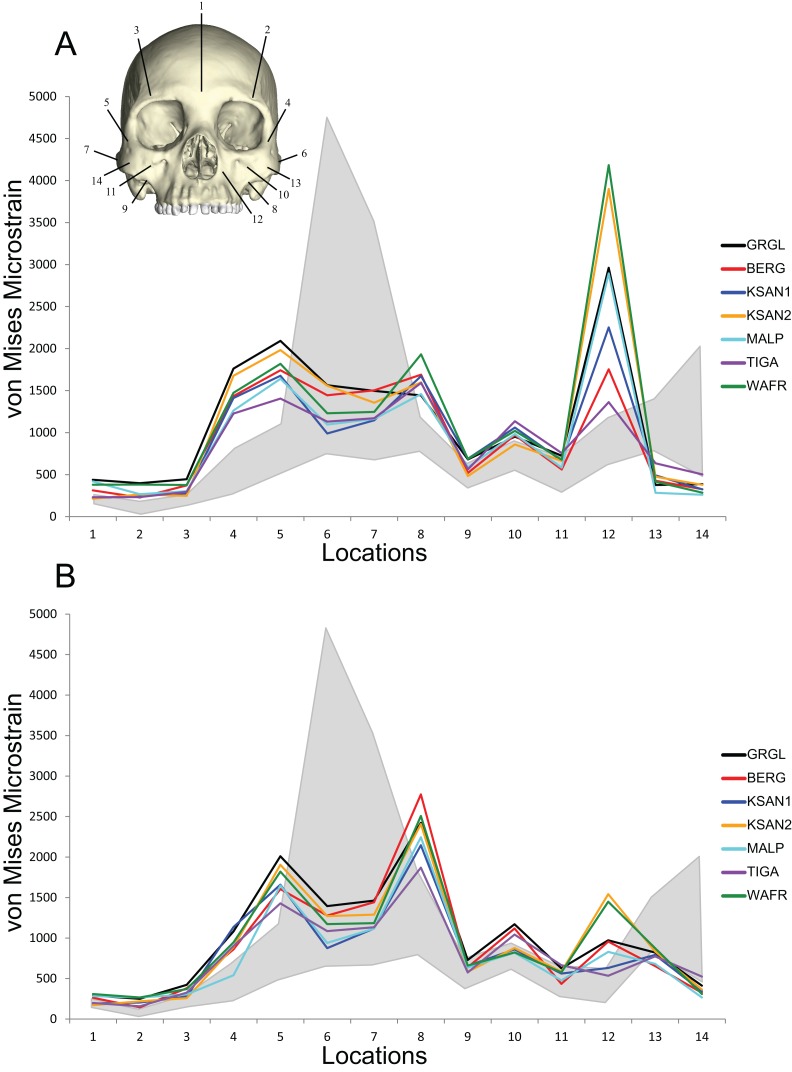
Figure 10. Line plots of von Mises microstrain generated during simulated biting in FEMs of humans and chimpanzees.
Strain data correspond to (A) left premolar (P3) and (B) left molar (M2) biting, recorded from 14 homologous locations in the CHIMPED variants of “extreme” and “average” modern human cranial FEMs. The gray region brackets the range of variation observed for chimpanzees by Smith et al. (2015b).

