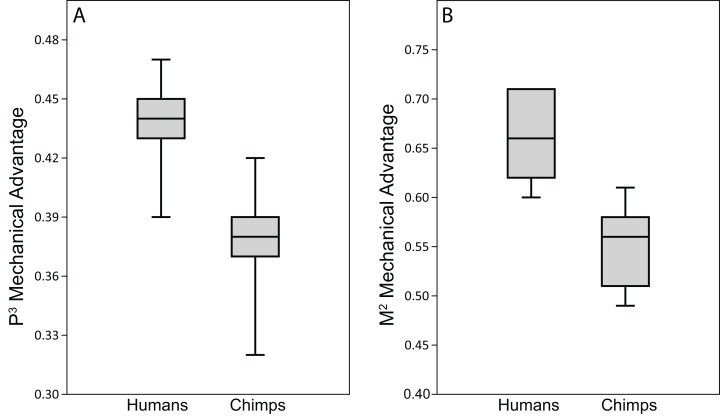
Figure 11. Biting efficiency: humans vs. chimpanzees.
Box-and-whisker plots show the minimum, first quartile, median, third quartile, and maximum biting efficiency, as quantified using the MA, in the CHIMPED variants of human cranial FEMs vs. chimpanzees at (A) premolar (P3) and (B) molar (M2) bite points. Chimpanzee data is from Smith et al. (2015b).

