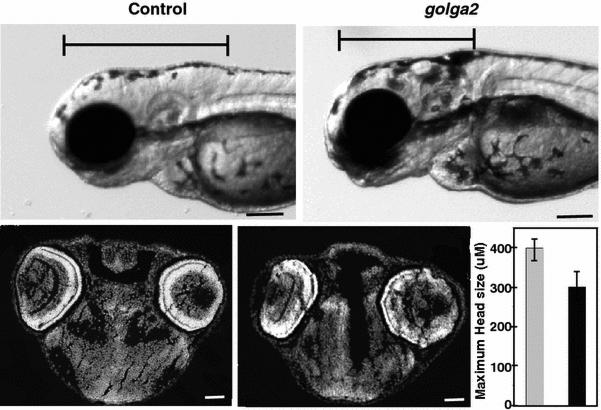
Figure 3. Knockdown of golga2 results in microcephaly in fish.

Morphant fish (e13-i13) exhibited smaller heads in comparison to wild-type controls. The length of brain was measured from forebrain to the beginning of first somite in both control and morphants (top panel). Cross-sections of brain (stained with DAPI) and quantification of brain diameter showed ~25% smaller brains in morphants (bottom panel).
