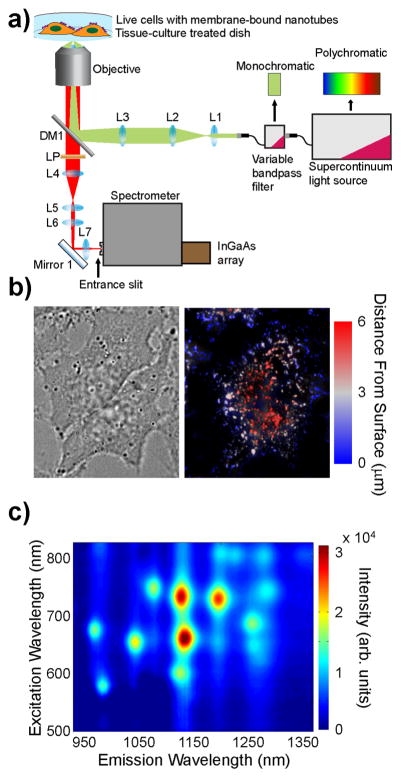
Figure 1.
Near-infrared photoluminescence spectroscopy of nano-tubes on live cells. (a) Schematic of 2D excitation/emission setup. (b) Transmitted white light and deconvolved broadband nIR height-colored z-axis projection images of live HeLa cells with surface-adsorbed DNA-SWCNTs. The z-axis distance from the substrate (μm) is color-coded from blue to red. (c) Photo-luminescence 2D excitation/emission plot of ss(AT)15-HiPco nanotubes on live HeLa cell membranes.

