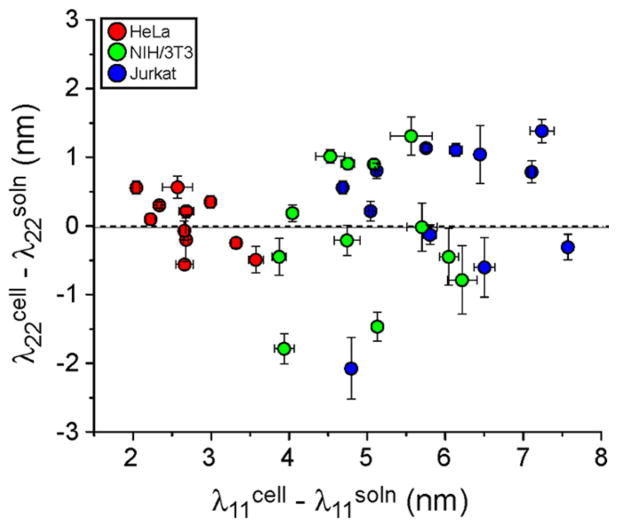
Figure 2.
Photoluminescence responses of ss(AT)15-HiPco nanotube complexes to cell membranes. The shifts in peak center wavelengths between nanotube complexes on cell membranes are plotted relative to values from nanotube complexes in solution (cell media without serum, denoted soln). Error bars represent S.E.M., n = 5 technical replicates.

