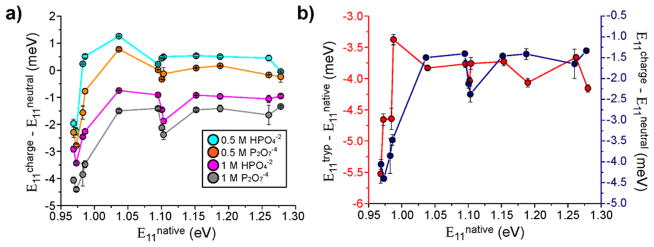
Figure 5.
Nanotube emission energy response to charge accumulation. (a) ss(AT)15-HiPco nanotubes introduced to 0.5 or 1 M sodium phosphate or potassium pyrophosphate. Nanotube emission energy change (meV) between ionic solutions and deionized water plotted as a function of emission energy (eV). (b) Emission energy change of nanotubes on HeLa cell membranes in a trypsinized state and a native state (red), and emission energy change between 1 M potassium pyrophosphate and deionized water (blue), as a function of nanotube emission energy. Error bars represent S.E.M, n = 3.

