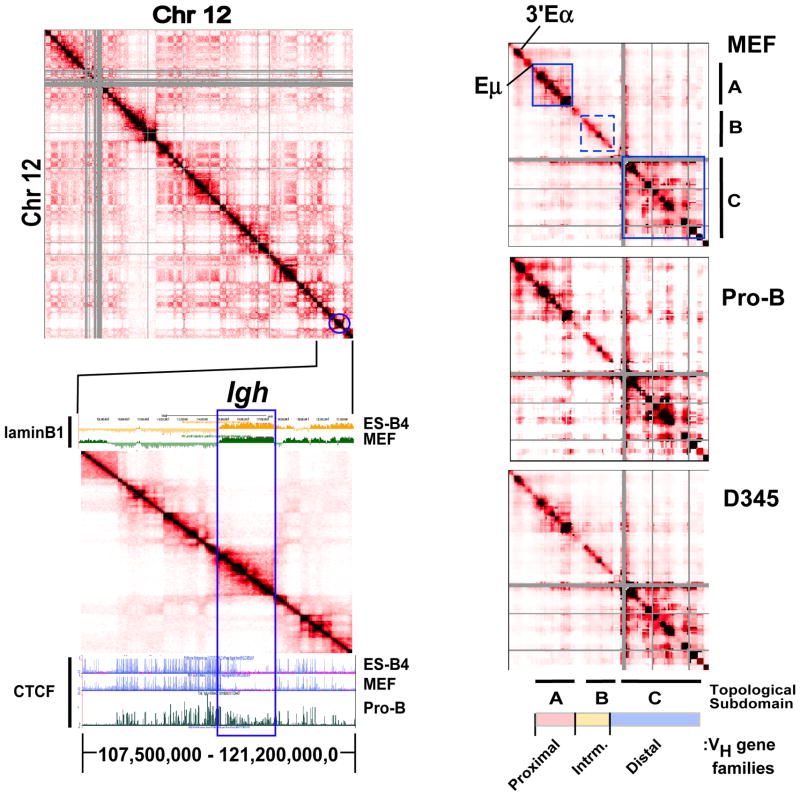
Figure 1. The Igh locus partitions into a 2.9 Mb TAD and conserved topological sub-domains.
A) (Upper panel) Normalized HiC interaction frequencies from an AMuLV pro-B cell line (adapted from Zhang et al 2012 (Zhang et al., 2012)) representing chromosome 12 is displayed as a 2D heatmap binned at 100 kb resolution. HiC sequencing reads are indicated by the color (red) intensity from interacting pairs of Hind III fragments. Gray pixels indicate areas of low uniquely mapped reads or regions with many large restriction fragments (>100 kb). (Lower panel) HiC data from chromosome 12 (107,500,000–121,200,000,0; mm9) is shown aligned to a UCSC Genome Browser snap-shot showing ChIP-seq for CTCF (Lin et al., 2012) and Dam-ID lamin B1 data (Peric-Hupkes et al., 2010) in the indicated cell types. B) 5C analyses of the 2.9 Mb Igh locus in MEF, Rag deficient pro-B cells and the AMuLV pro-B cell line, D345. Normalized 5C data underwent binning analysis (bin size, 150,000 kb; step size,15 kb). Topological sub-domains A, and C are indicated by the solid blue outline and B by dashed blue lines). The heat maps are scaled as follows: MEF 37–1840, Rag2−/− pro B cells: 19–1254, D345: 89–6355.

