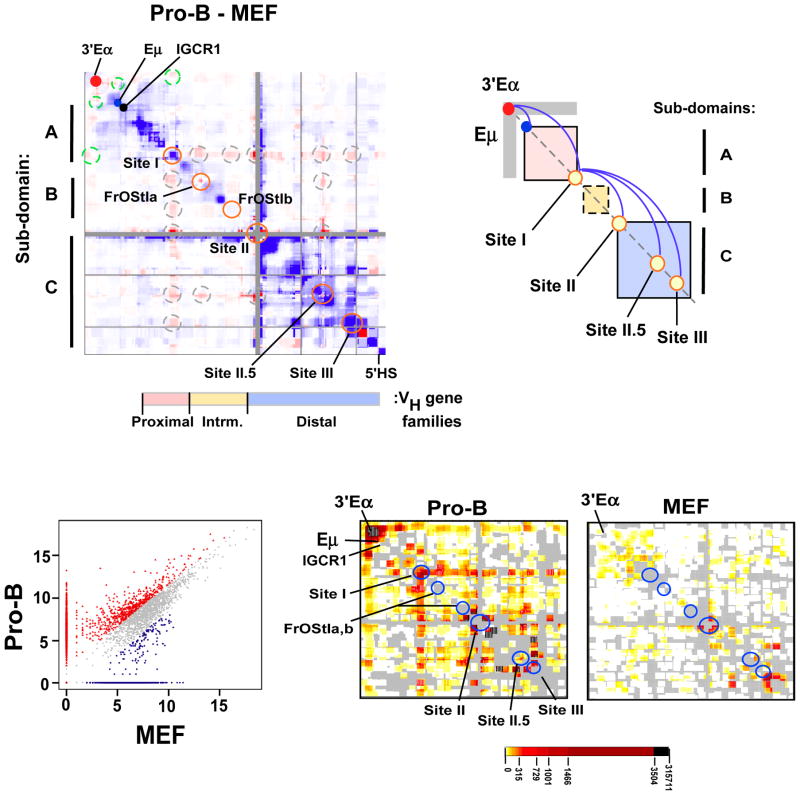
Figure 2. Developmentally programmed reorganization of the Igh locus chromatin architecture in pro-B cells.
A) A difference plot (pro-B cells minus MEF) was calculated using normalized 5C signals (150 kb bins, 15 kb step). Elevated 5C reads in pro-B (red intensities), or MEF (blue intensities) or constitutive (white). Dots are: 3′Eα (red), Eμ (blue) and IGCR1 (black). Looping interactions associated with 3′Eα (dashed green circles). Sites I (115,100,000–115,239,000; 139kb), II (115,949,000–116,069,000; 120kb), II.5 (116,665,000–116,770,000; 105kb), III (116,784,000–116,874,000; 90kb) and FrOStIa (115,411,000–115,451,000; 40kb), FrOStIb (115,819,000–115,859,000; 40kb) are indicated along the diagonal (orange circles) and looping interactions off the diagonal are shown (dashed gray circles). Genomic coordinates are chr12, mm9. VH gene families and topological sub-domains A–C are indicated. B) A diagram of topological sub-domains A (pink), B (yellow), C (blue) boxes with Eμ and 3′Eα, as indicated. Sites I–III are shown (yellow circles). Gray rectangular arms extending from 3′Eα indicate increased interactions in pro-B cells. The pro-B cell specific loops (blue arches). C) Scatterplot of 5C interactions (colored dots) (constitutive, gray; pro-B cell, red; MEF, blue). Cell type specific interactions were >3-fold above the constitutive frequency (see Suppl. Methods). D) The pro-B and MEF specific 5C interactions defined in (B) are plotted as 2D heatmaps (100 kb bins, 10kb step). The frequency of 5C reads is indicated by the color key and gray indicates the absence of interactions.

