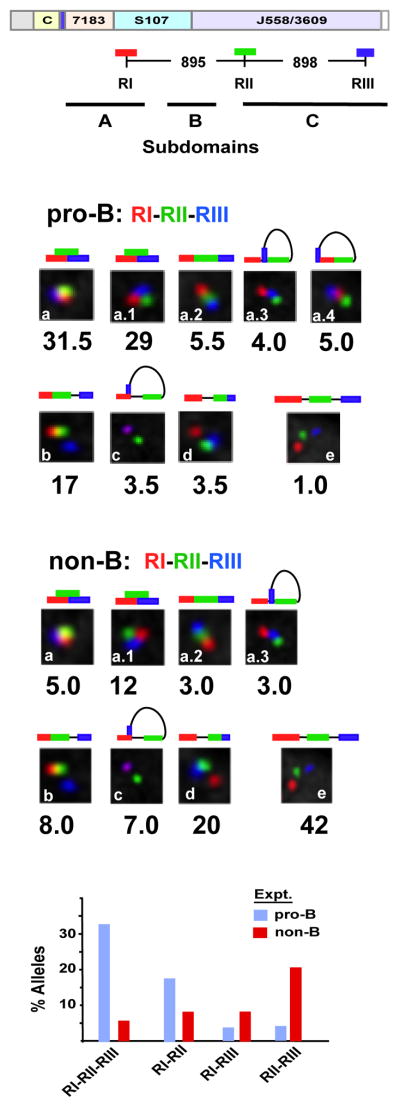
Figure 4. Sites I-II-III are selectively superimposed in pro-B cells.
Three color FISH data for ~200 nuclei for each probe set. Allele configurations and probe distances are defined in Figure S6. Purified pro-B cells from at least three mice for each of two experiments. P values are derived in Kolmogorov-Smirnov and the Wilcoxon tests (see Table S6). A) A schematic of the WT Igh locus with genomic distances between BAC probes. The probes combinations are RI (red), RII (green) and RIII (blue). The topological sub-domains A, B and C that are derived from the 5C studies shown in Figure 2 are arrayed at bottom. B,C) BAC probes RI, RII and RIII, labeled as indicated, were hybridized simultaneously to Rag2-deficient pro-B cells (B) or non-B cells (C) from bone marrow of Rag2-deficient mice. The percentage of Igh alleles in various spatial configurations as schematized above each inset is indicated. D) Histograms summarizing the three color FISH results shown in (b) and (c) using the probe combinations RI, RII and RIII for pro-B cells (blue bars) and non-B lineage cells (red bars) (x-axis). The percentage of alleles in which two- or three-probes are superimposed or in very close contact are indicated (y axis).

