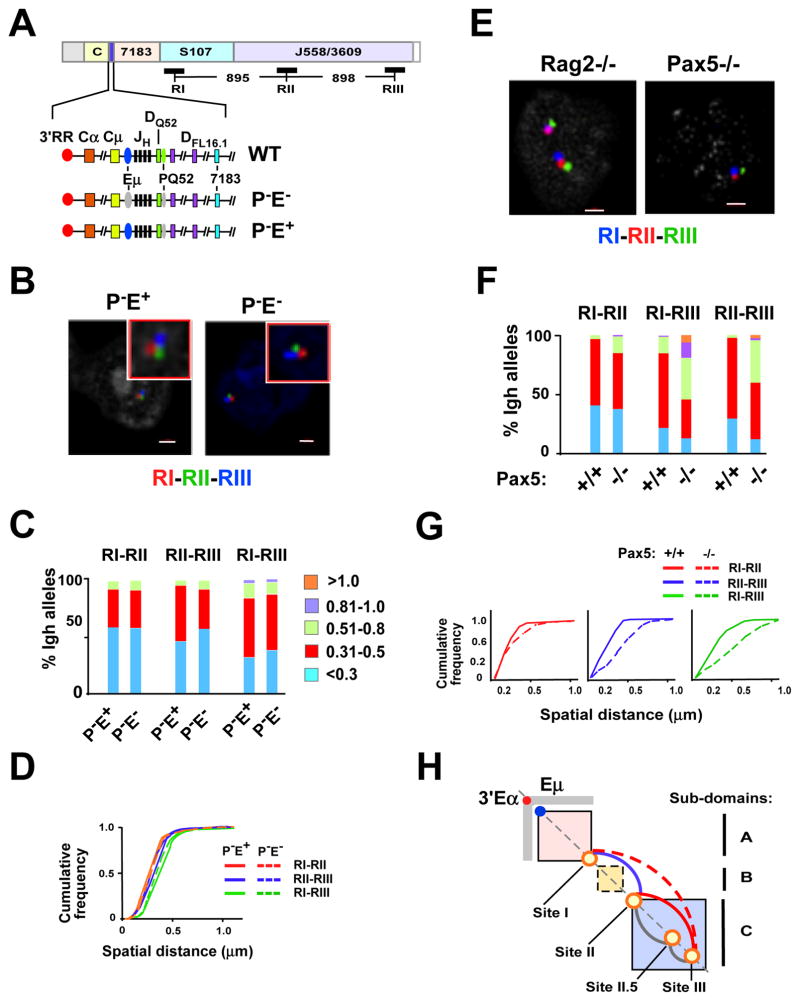
Figure 5. Locus contraction mediated by Sites I-II-III is Eμ independent but requires Pax5.
A) A diagram of the Igh locus indicates the location and distances between the three FISH probes RI, RII and RIII. The lower three lines show an expanded section of the Igh locus from 3′RR through the DH cluster and ending with the proximal VH gene segment, 7183. Eμ (blue oval) is a transcription enhancer located in the JH-Cμ intron and PQ52 (green oval) is a promoter associated with the 3′ most DH gene segment, DQ52. Deletions of PQ52 (P−) and/or Eμ (E−) are indicated (gray ovals). B) Three color FISH using purified Rag deficient pro-B cells that are deleted for PQ52 (P-E+) and for both PQ52 and Eμ (PE−). BAC probes are RI (red), RII (green) and RIII (blue). A representative nucleus is shown for each genotype. Probes contacts were red and green (RI–RII), red and blue (RI–RIII) and green and blue (RII–RIII). C) Quantitation of FISH data. The distance between the red, green and blue FISH signals shown in (B) for ~200 nuclei were divided into 5 categories: <0.3, 0.31–0.5, 0.51–0.8, 0.81–1.0, >1.0 μm. The percentage of Igh alleles in each category (y axis) for each Igh genotype (x-axis) is represented in different colors. Probe combinations are shown above the histograms. Purified pro-B cells from at least three mice were used for each experiment. Data are from at least two independent experiments. D) Cumulative frequency analyses are shown for each probe combination and the genotypes are indicated. P values are defined by Kolmogorov-Smirnov and Wilcoxon tests (see Table S6). E) Three color FISH using Rag2−/− or Pax5−/− pro-B cells and BAC probes are as in (A) and were labeled as follows: RI (blue), RII (red) and RIII (green). Representative nuclei from each genotype are shown. F) Distances between the probe signals were analyzed in ~100 nuclei. G) Cumulative frequency analyses are shown. P values are summarized in Table S6. H) A diagram of Igh topological subdomains A (pink box), B (yellow box) and C (blue box). Eμ (blue dot), 3′Eα (red dot) and Sites I, II, II.5 and III (orange circles) are located along the diagonal. The gray rectangular arms extending from 3′Eα indicate increased 5C interactions in pro-B cells. Loops that anchored at Sites I, II, II.5 and III and that are Pax5-dependent (red, dashed red), Pax5-independent (blue), and not tested (gray).

