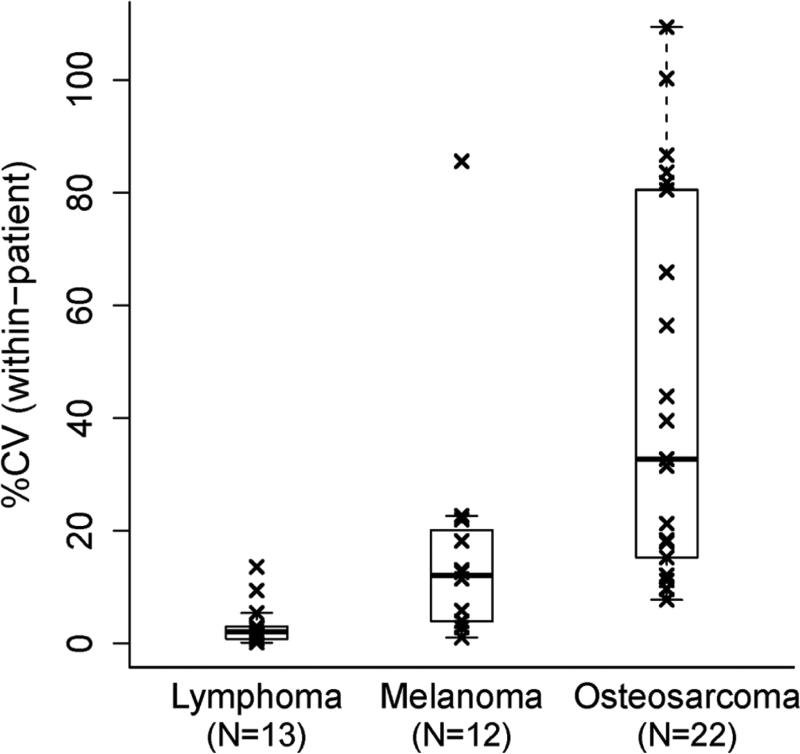
Figure 3.
Dispersion analyses of the proportion of cancer biorepository tissue sections occupied by tumor. Box-whisker plots show distributions of the within-patient coefficient of variation (%CV) of the tumor tissue percentage estimates for three cancer types. Specimen comparisons represent multiple portions from the same cancer masses (subdivided for biobanking purposes) excised for each patient's initial diagnosis. The line in the middle of the box represents the median, with the lower and upper edges showing the first and third quartiles, respectively. The whiskers extend to the extreme values and the outliers are the coefficients of variation exceeding 1.5*IQR (interquartile range). Image reproduced with permission from the Journal of Biomolecular Techniques (JBT), ©Association of Biomolecular Resource Facilities, www.abrf.org. (27).

