FIGURE 1.

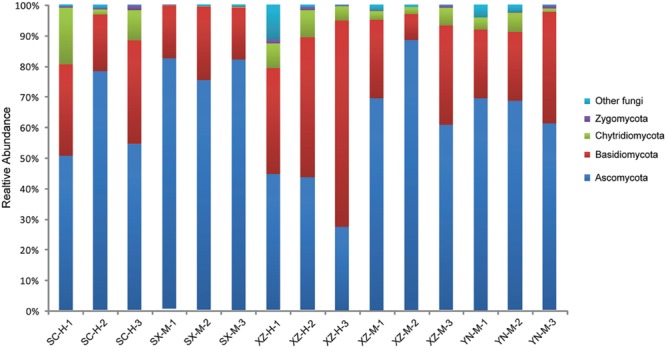
The fungal community structure at the phylum level in the 15 samples. The histogram was created using EXCEL and processed using Adobe Illustrator CS4. Different colors represent the different phyla of fungi.

The fungal community structure at the phylum level in the 15 samples. The histogram was created using EXCEL and processed using Adobe Illustrator CS4. Different colors represent the different phyla of fungi.