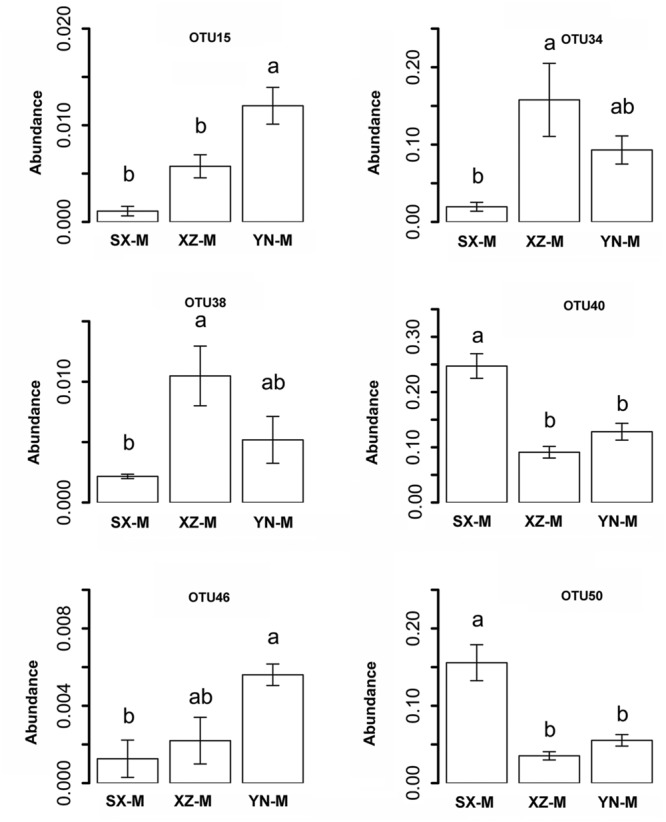
FIGURE 3.

The relative abundance of indicator OTUs with site effect. The error bars indicate the standard error (mean ± SE). Different letters above the bars indicate the significance under P < 0.05. SX-M, XZ-M, and YN-M represent the three localities with same type of altitude.
