
FIGURE 4.
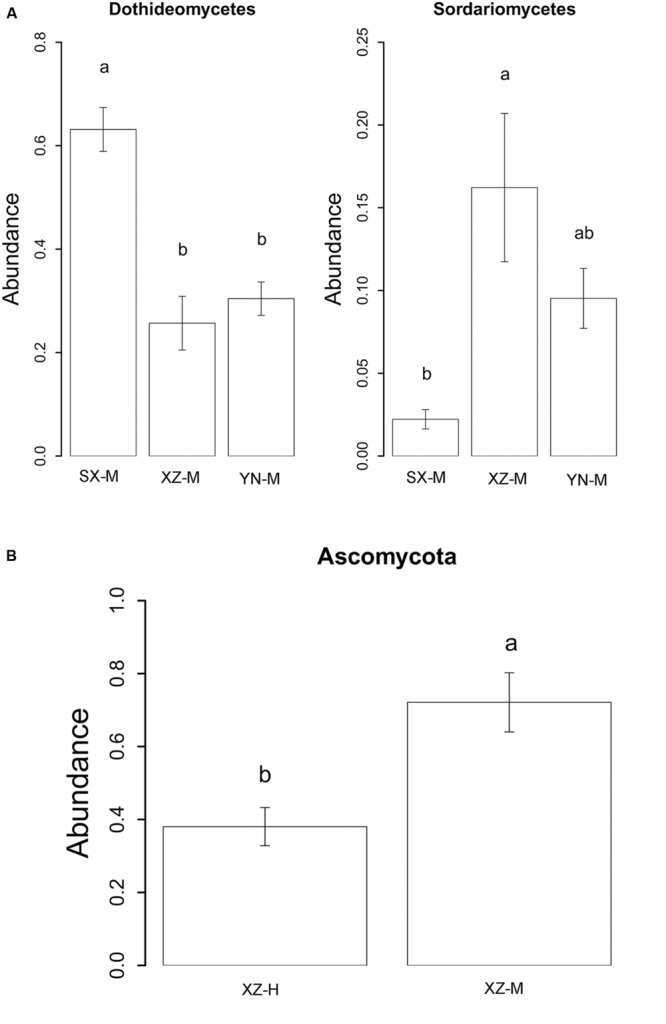
The relative abundance of indicator class (A) with site effect and phylum (B) with altitude effect. The histogram was graphed using R. The error bars indicate the standard error (mean ± SE). Different letters above the bars indicate the significance under P < 0.05. SX-M, XZ-M, and YN-M represent the three localities with same type of altitude. XZ-H and XZ-M represent the two altitudes of same locality.