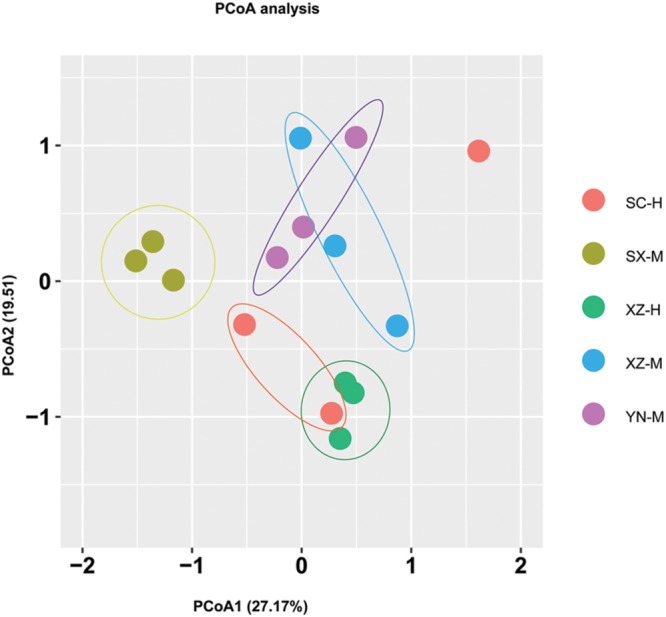
FIGURE 5.

Principal coordinate analysis (PCoA) of fungal community composition affected by site and altitude. The PCoA analysis was conducted and plotted using packages of “vegan” and “ggplot2,” respectively, in R. Different color of circle dots represents the five sets samples, respectively. Three circle dots with same color mean the three duplicates of the same group of samples.
