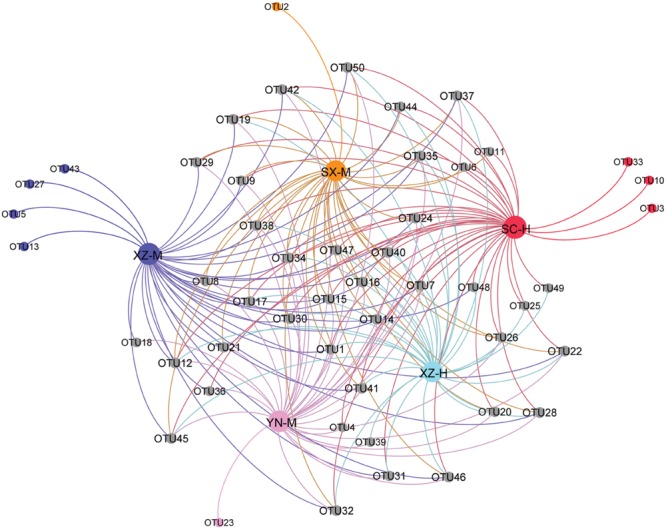
FIGURE 6.

Gehpi diagram of total 50 OTUs in the five sets samples. Gephi 0.8.2 software was performed to illustrate the common and the special OTUs distribution among the 5 five sets samples. The gray circle dots represent the common OTUs, while the circle dots with different colors represent the special OTUs contained in the each group of samples.
