Figure 3.
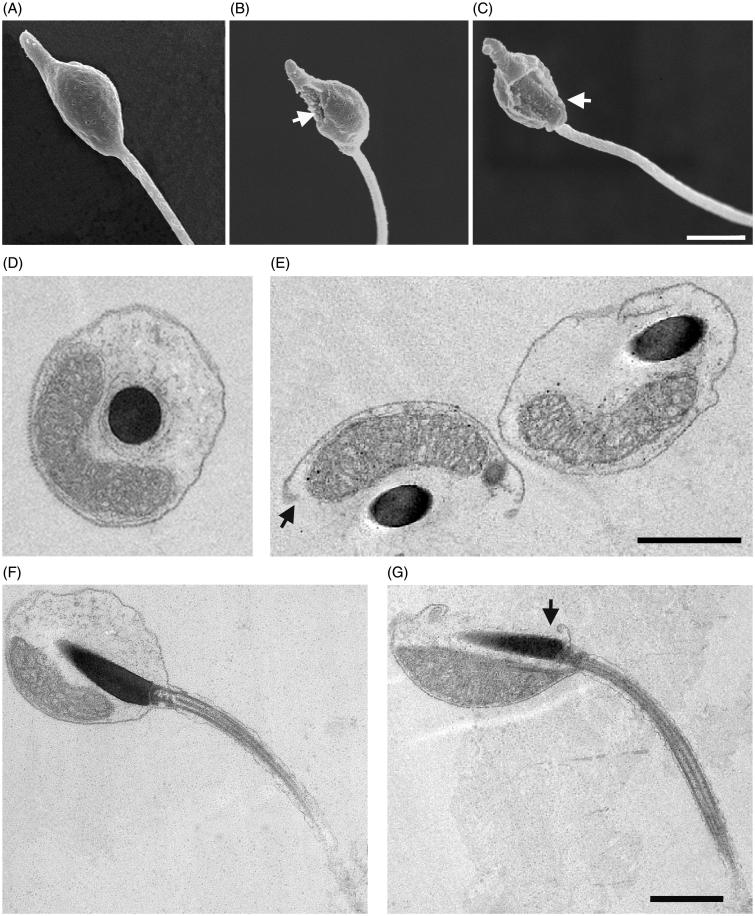
Effects of Ni NPs on sperm ultrastructure. Representative SEM images of control sperm (A) and sperm exposed for 2 h to Ni NPs at concentrations higher than 0.025 (B, C) show holes in the plasma membrane indicated by arrows. TEM images of transversal and longitudinal sections of control sperm (D, F) and sperm (E, G) exposed as above that show interruptions of plasma membrane continuity as indicated by arrows. Scale bars are 1 μm.

