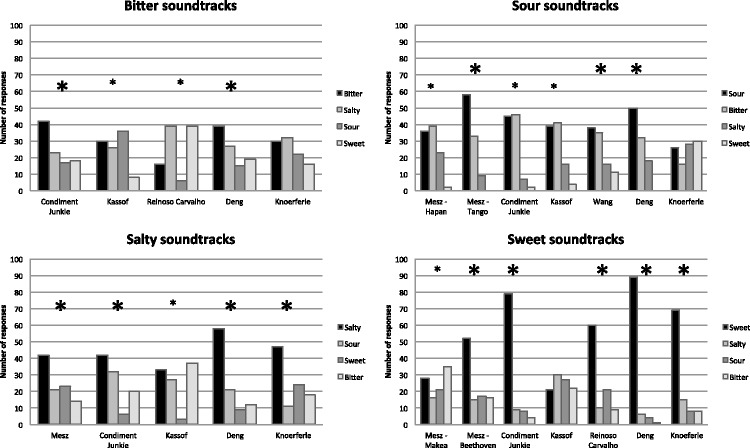
Figure 1.
Results of participants’ soundtrack-taste matching organized by each taste that the soundtracks were designed to evoke in Experiment 1. The chart reveals the distribution of participants’ choice of taste matches for each soundtrack, with a total of 100 responses for each soundtrack. Soundtracks with nonrandom distributions of taste ratings (i.e., participants are not just matching tastes by chance) are shown with asterisks (p < .05); out of these, the soundtracks where the most chosen taste was also the taste intended by the composer are shown by larger asterisks.

