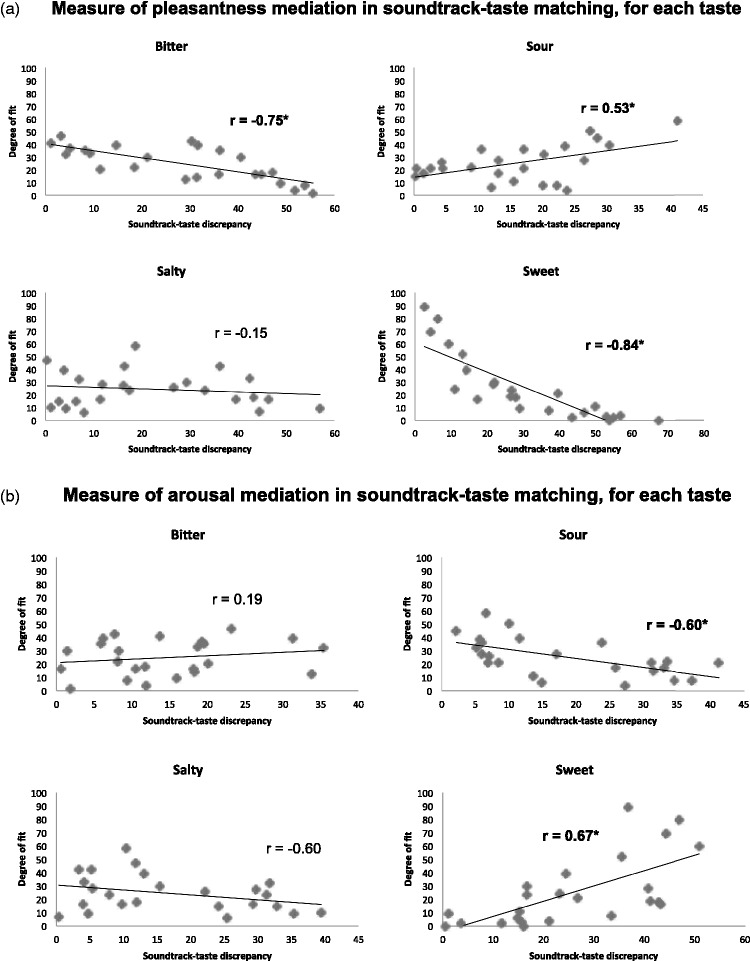
Figure 7.
A measure of the degree of pleasantness (a) and arousal (b) mediation in soundtrack-taste matching, shown as the relationship between soundtrack-taste discrepancy from Experiment 2 (in terms of differences in pleasantness/arousal ratings of a given soundtrack-taste pair) and the degree of fit between each soundtrack and a given taste (represented by the % of responses to the soundtrack-taste matching question for a given taste from Experiment 1). The Pearson correlation coefficient is shown on each plot along with a linear regression trend line. Asterisks after the correlation coefficient indicate statistical significance (p < .05).

