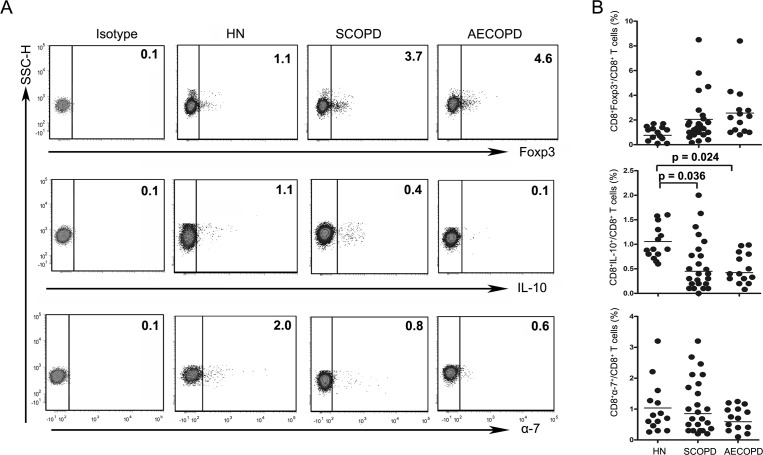
Figure 3. The percentage of Tc10 cells is decreased in both the SCOPD and AECOPD groups.
(A) Representative flow cytometric dot plots of CD8 +Tregs, Tc10 and CD8+α7+ T cells (CD8 + Tregs: CD3 +CD8 +FOXP3 + T cells; Tc10: CD3 +CD8 +IL-10 + T cells; CD8+α7+: CD3 +CD8+α7+ T cells) in HN, SCOPD patients and AECOPD patients are shown. (B) Comparisons of the percentages of CD8 + Tregs, Tc10 cells, and CD8+α7+ T cells in HN, SCOPD patients and AECOPD patients (n = 14, 24, and 14, respectively) are shown. Horizontal bars indicate the mean values.

